Comparison and assessment of the cost with advertising budget using MS Excel Power Query

Story: The advertising department of the company X offers to its distributors
promotional items - flyers, leaflets, hats, calendars, T-shirts.
Each ad item has a price and it can be distributed in limited quantities.
The employees of advertising department create a document for distributed promotional items.
The documents contain information about the type and
value for each item and also the month when the item should be used.
The advertising department works with a budget for costs by month per every ad items.
The budget should include the following checks:
- compare the costs with those given in budget and indicate the minus ones
- calculate the values of received materials by distributor monthly
Solution: In order to solve these tasks, it is necessary to merge all data
for ad items and then to compare it with the budget data.
MS Excel Power Query has the following advantages for our tasks:
- It can avoid mistakes associated with the repetition or omission of document data.
- If some document has been updated the created query can be updated also.
Step One: Every document must be formatted with "Format as Table"

Step Two: Crate query for the first document
Power Query -> From File -> From Excel –> Select File -> Edit

We edit document 100 with name ”Distribution 100.xls” as query.
Step Three: Remove unnecessary columns

Step four: Select "Close & Load" to create new worksheet with documents data
Repeat the last two steps for each next document.
All queries must have suitable name for better control.
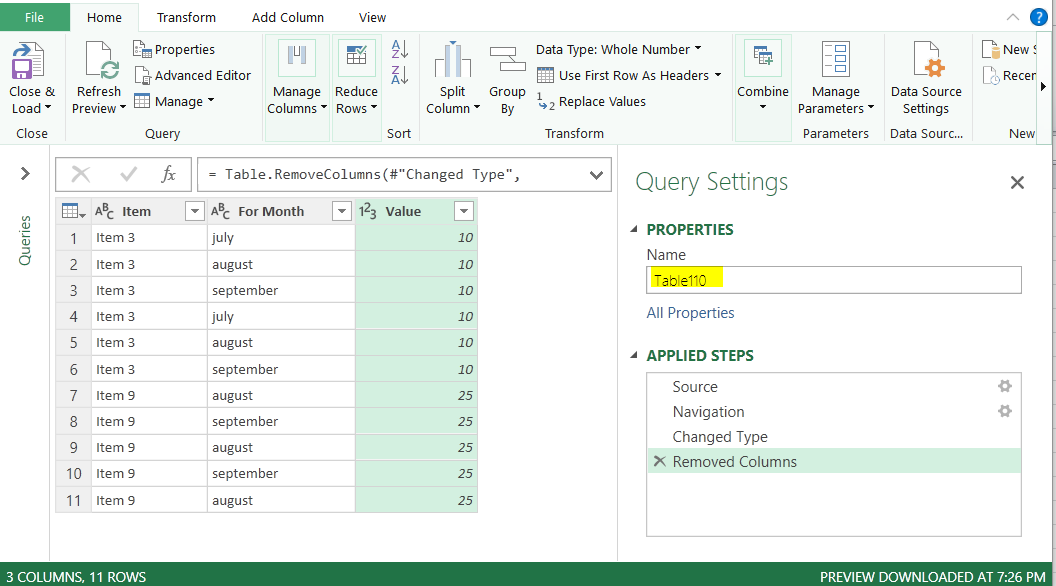
The query with name Table110 is for document 110 here.
After “Close & Load”:

For returning to Power Query you can use the button "Edit Query" in the worksheet after clicking in the table

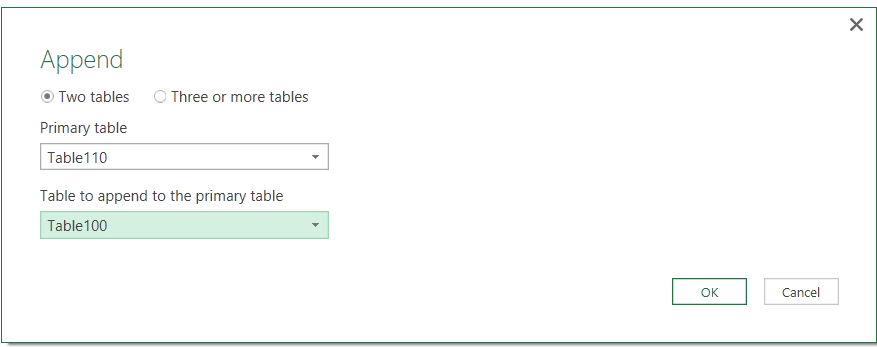
Step five: After calling the last document you can create query for merging all in one
Home -> Append Query as New

From "Append" dialog select two tables (or three or more tables in case of more)
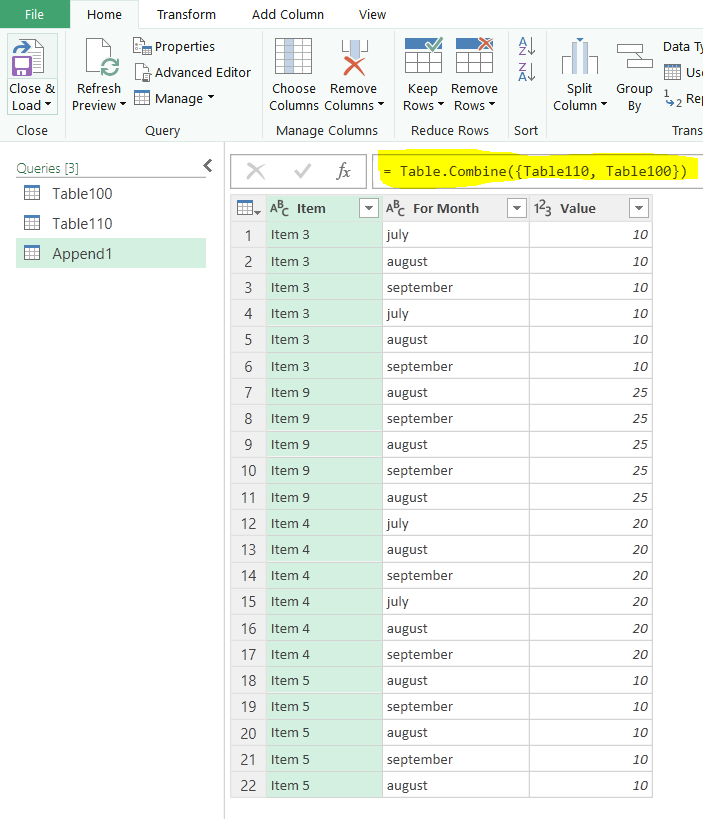
And this is the result from merging the data
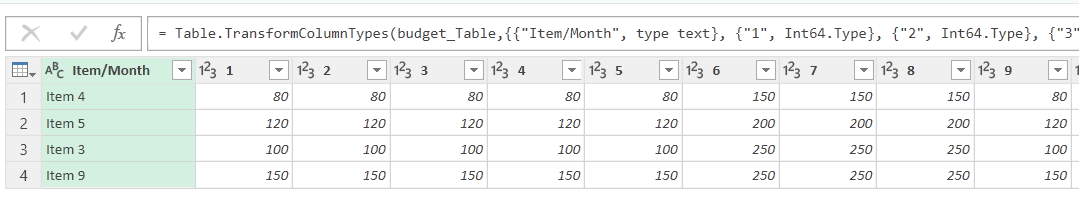
In case it is required to change the name of the month with number you can do
Select Column for Month -> Transform ->Replace Values

We can format these values as integers doing this (not mandatory):
For Month as Data Type -> Whole Number
We can cancel command from
Query Settings – Right mouse button – Delete.

We can perform calculations with values of the columns.
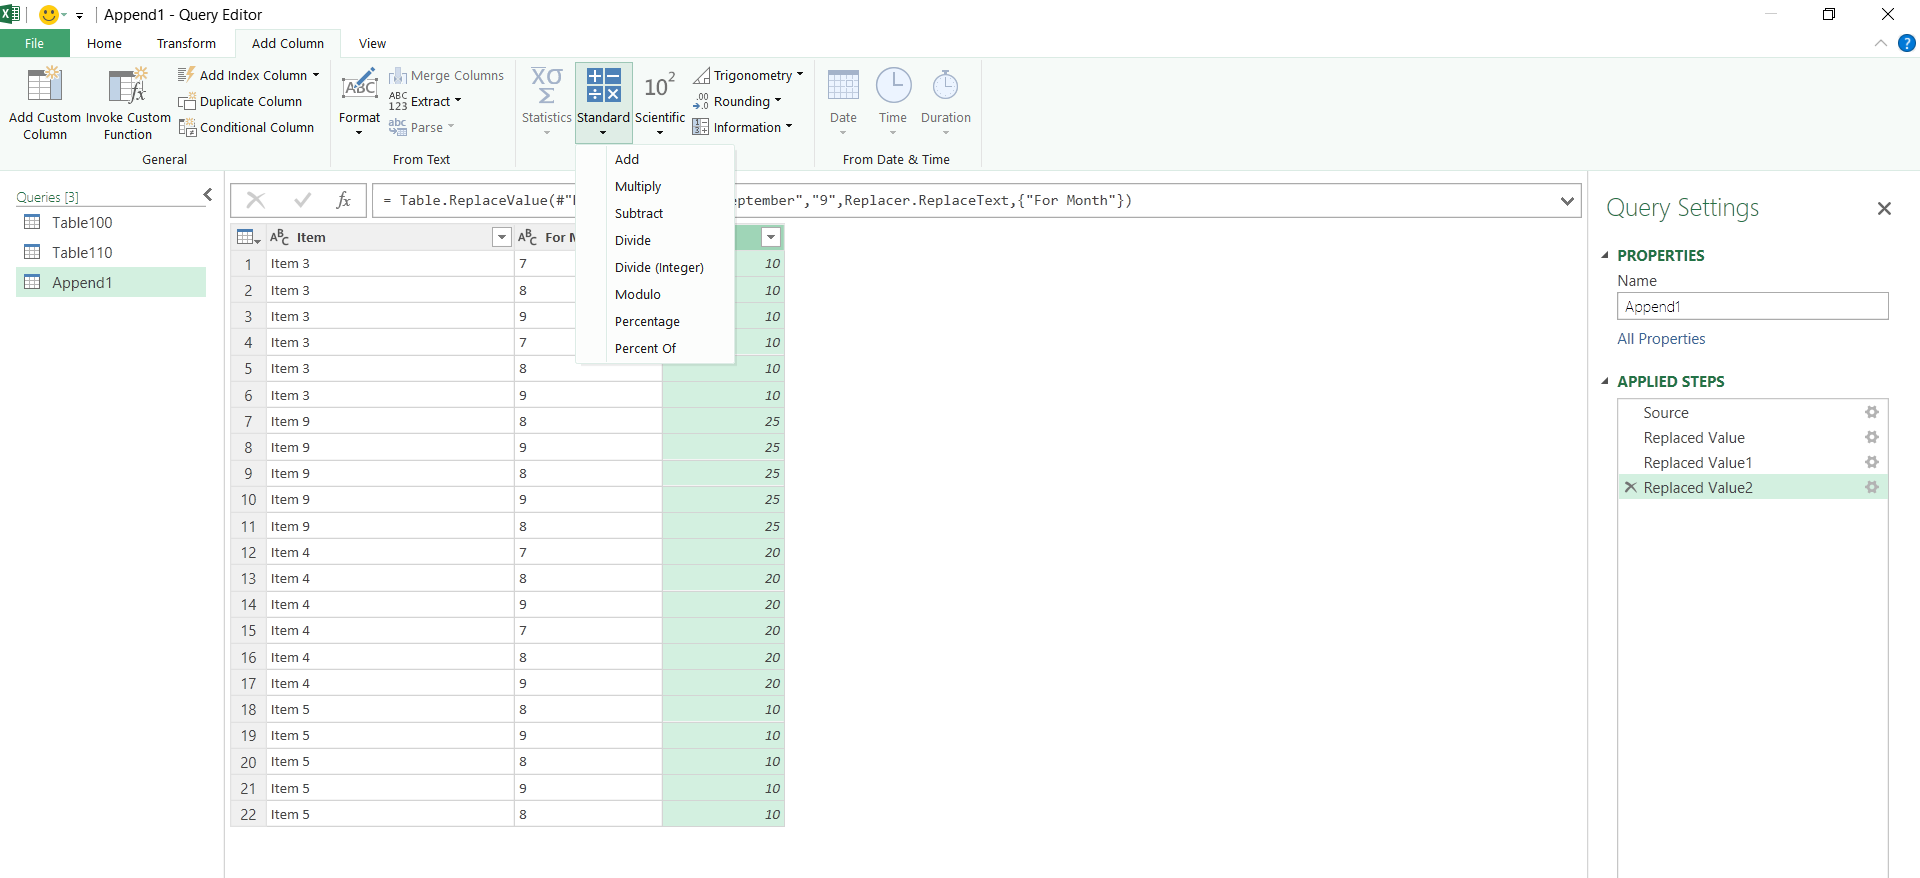
Then we will multiply the Value column with minus 1 because the values have already been used in terms of budget.

Also we can change the name of the newly column.

We can delete the column Value without changing column Budget value.

Now you can see the formula above in the bar. The newly created Query can be turned into a worksheet in usual way.
Step six: Add budget data
Budgets Crosstab format is not convenient for working with databases.
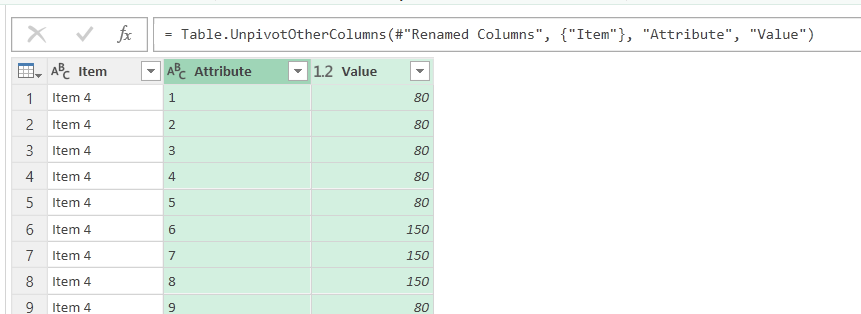
That’s why we can change the name of the first column of Item.

Select the first column and click to Transform -> Unpivot Other Columns
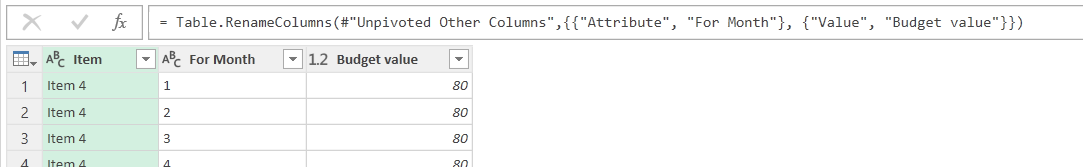
Then change the columns names to For Month and Budget Value.
Step seven: Merge budget data with data from multiple documents (Append)
Go to Append -> Append Queries As New

Now the name of the new query is AllData.
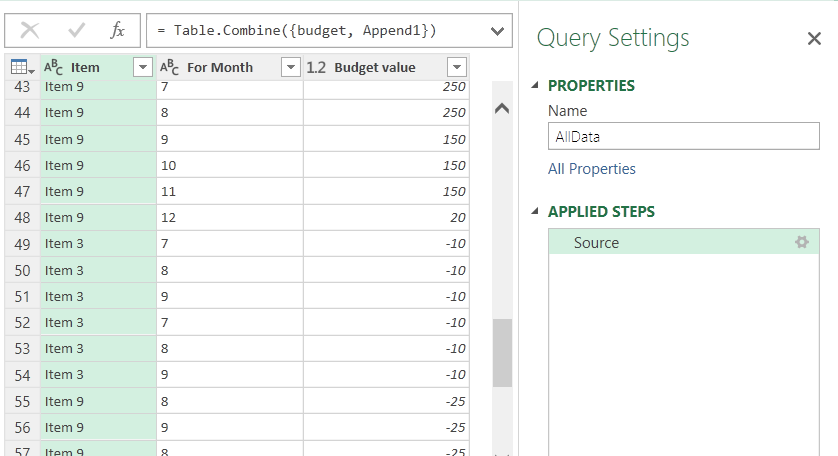
Use Close & Load to create new worksheet with all data.
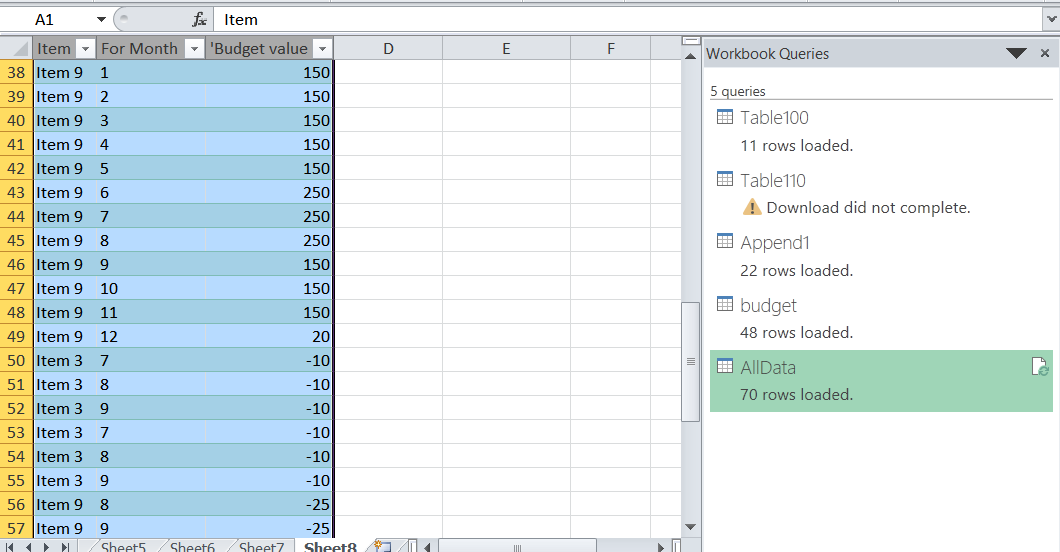
The workbook Queries contains list of all Queries and current problems. Also all data from Table110 is in query Append1.
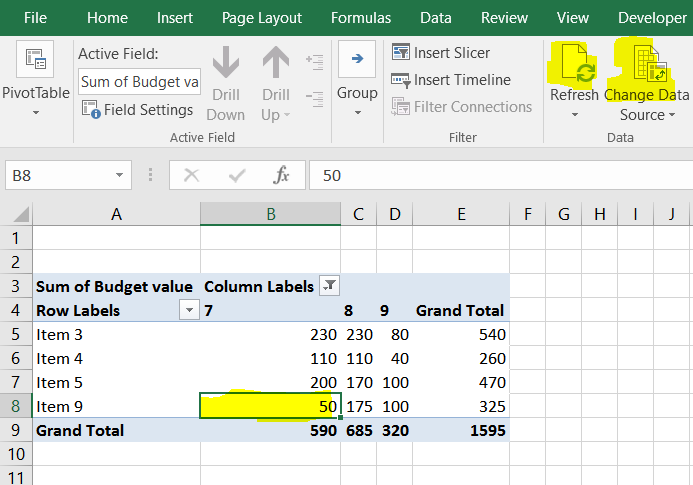
Step eight: Create Pivot Table for analyze the data


If we compare the budget, we can see that the values have decreased but still positive.

In case for some months we got negative values this means that we exceed the budget and have to compensate it with other months. In order to do this:
Save the file as a BudgetCalculation and close.
Let us now make changes in the file Document 100.
We'll add row for distributed “Item 9” with value 200.
Step Nine: Update the queries
Open the file again and Enable Content.


In list of Document 100 we add value 200 for Item 9.
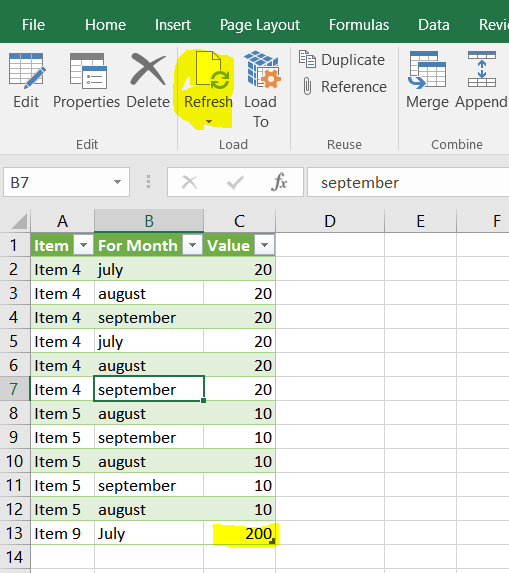
Click Refresh to update the data in the worksheet.
Then the query AllData is also updated.
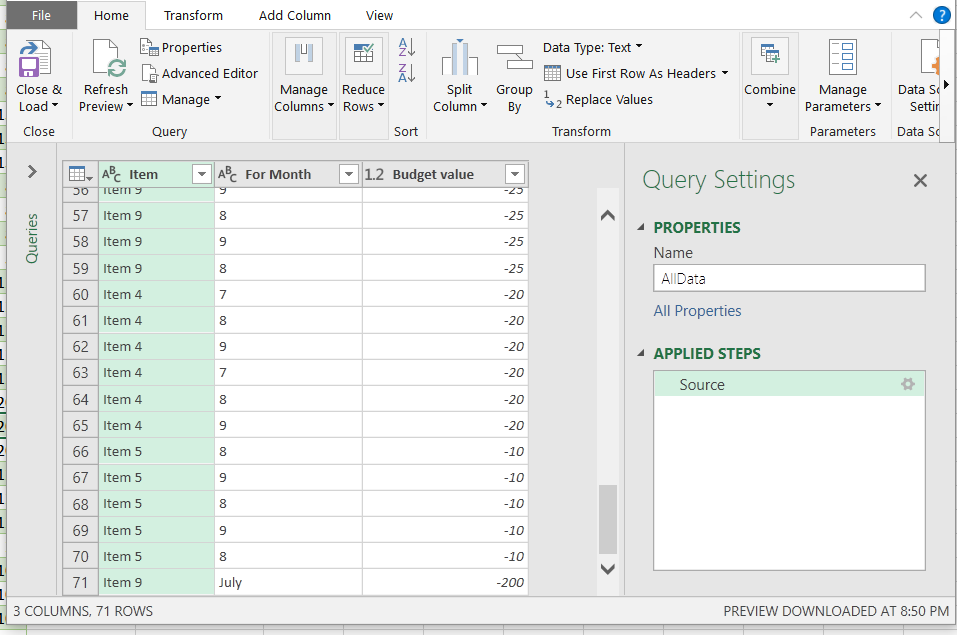
To update the worksheet for query AllData click Refresh. It is possible to change July to ”7”.
We can check also the Pivot source data with Refresh and receive current data.
Conclusion: The employees of the advertising department can just enter their data into the correct file. Then the officer who monitor the budget can easily update the data with executing the necessary requests/statements.
Hints: If you need to see the names of distributors you can leave the columns in a query.
Hints: These queries can be created using database that keeps the events related to current assets.
Then you can easily pull the necessary data to their current status in the required format.
